


November 2026
Redesigned Webhooks Pages
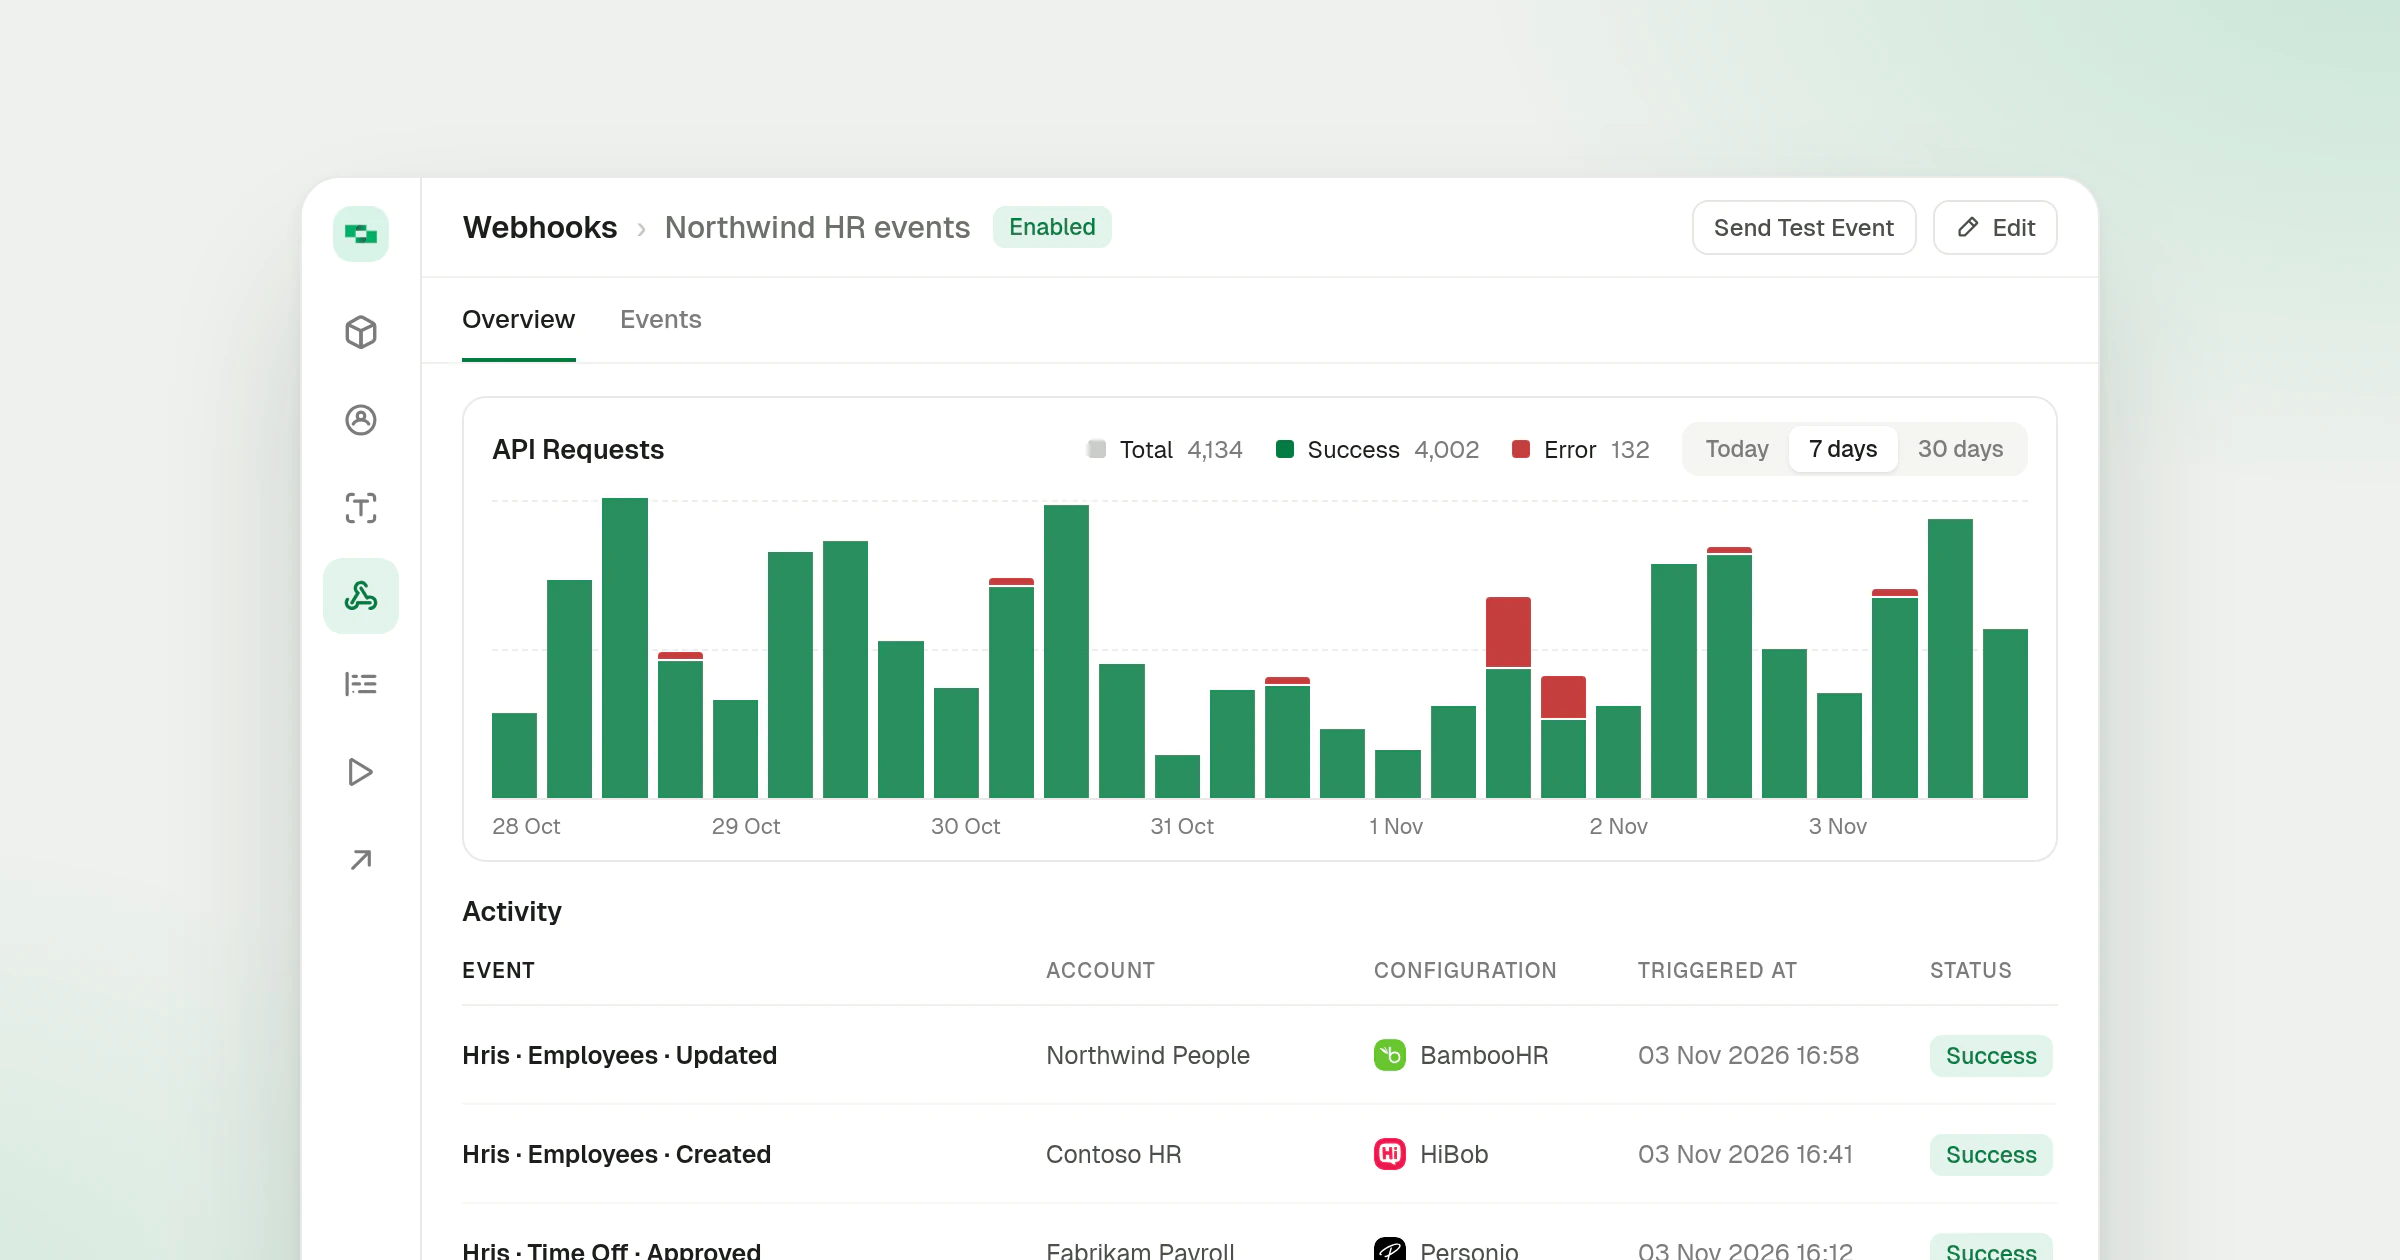
The Webhooks list and detail pages in the dashboard are rebuilt on the same components as the Logs, Accounts and API Keys pages. A webhook’s Overview chart now has a Today, 7 days and 30 days switch, with the totals for the chosen period in its title row.
What’s new
- A complete 7 day view. The 7 days view draws one bar every 6 hours and its total covers the whole week. It used to draw one or two wide bars and leave some deliveries out of the total.
- Failed deliveries in red. The 7-Day Volume bars on the list draw failures in red, fading with the day’s volume the way successes do in green. They were light grey before.
- Counts on the tabs. Each tab on the list shows its count beside the label.
- Last Triggered on every row. The list reads each webhook’s last delivery from the webhooks API, so a busy webhook no longer leaves the others blank. The list shows 25 webhooks a page.
- Links that behave like links. Menu items that open a new tab are real links you can middle-click or copy.
The Webhooks docs cover subscribing to connector and StackOne events, and the Native Webhooks entry describes the connector events these pages deliver.