
July 2026
Revamped Logs Page and Public API: See Every Tool Call Your Agents Make
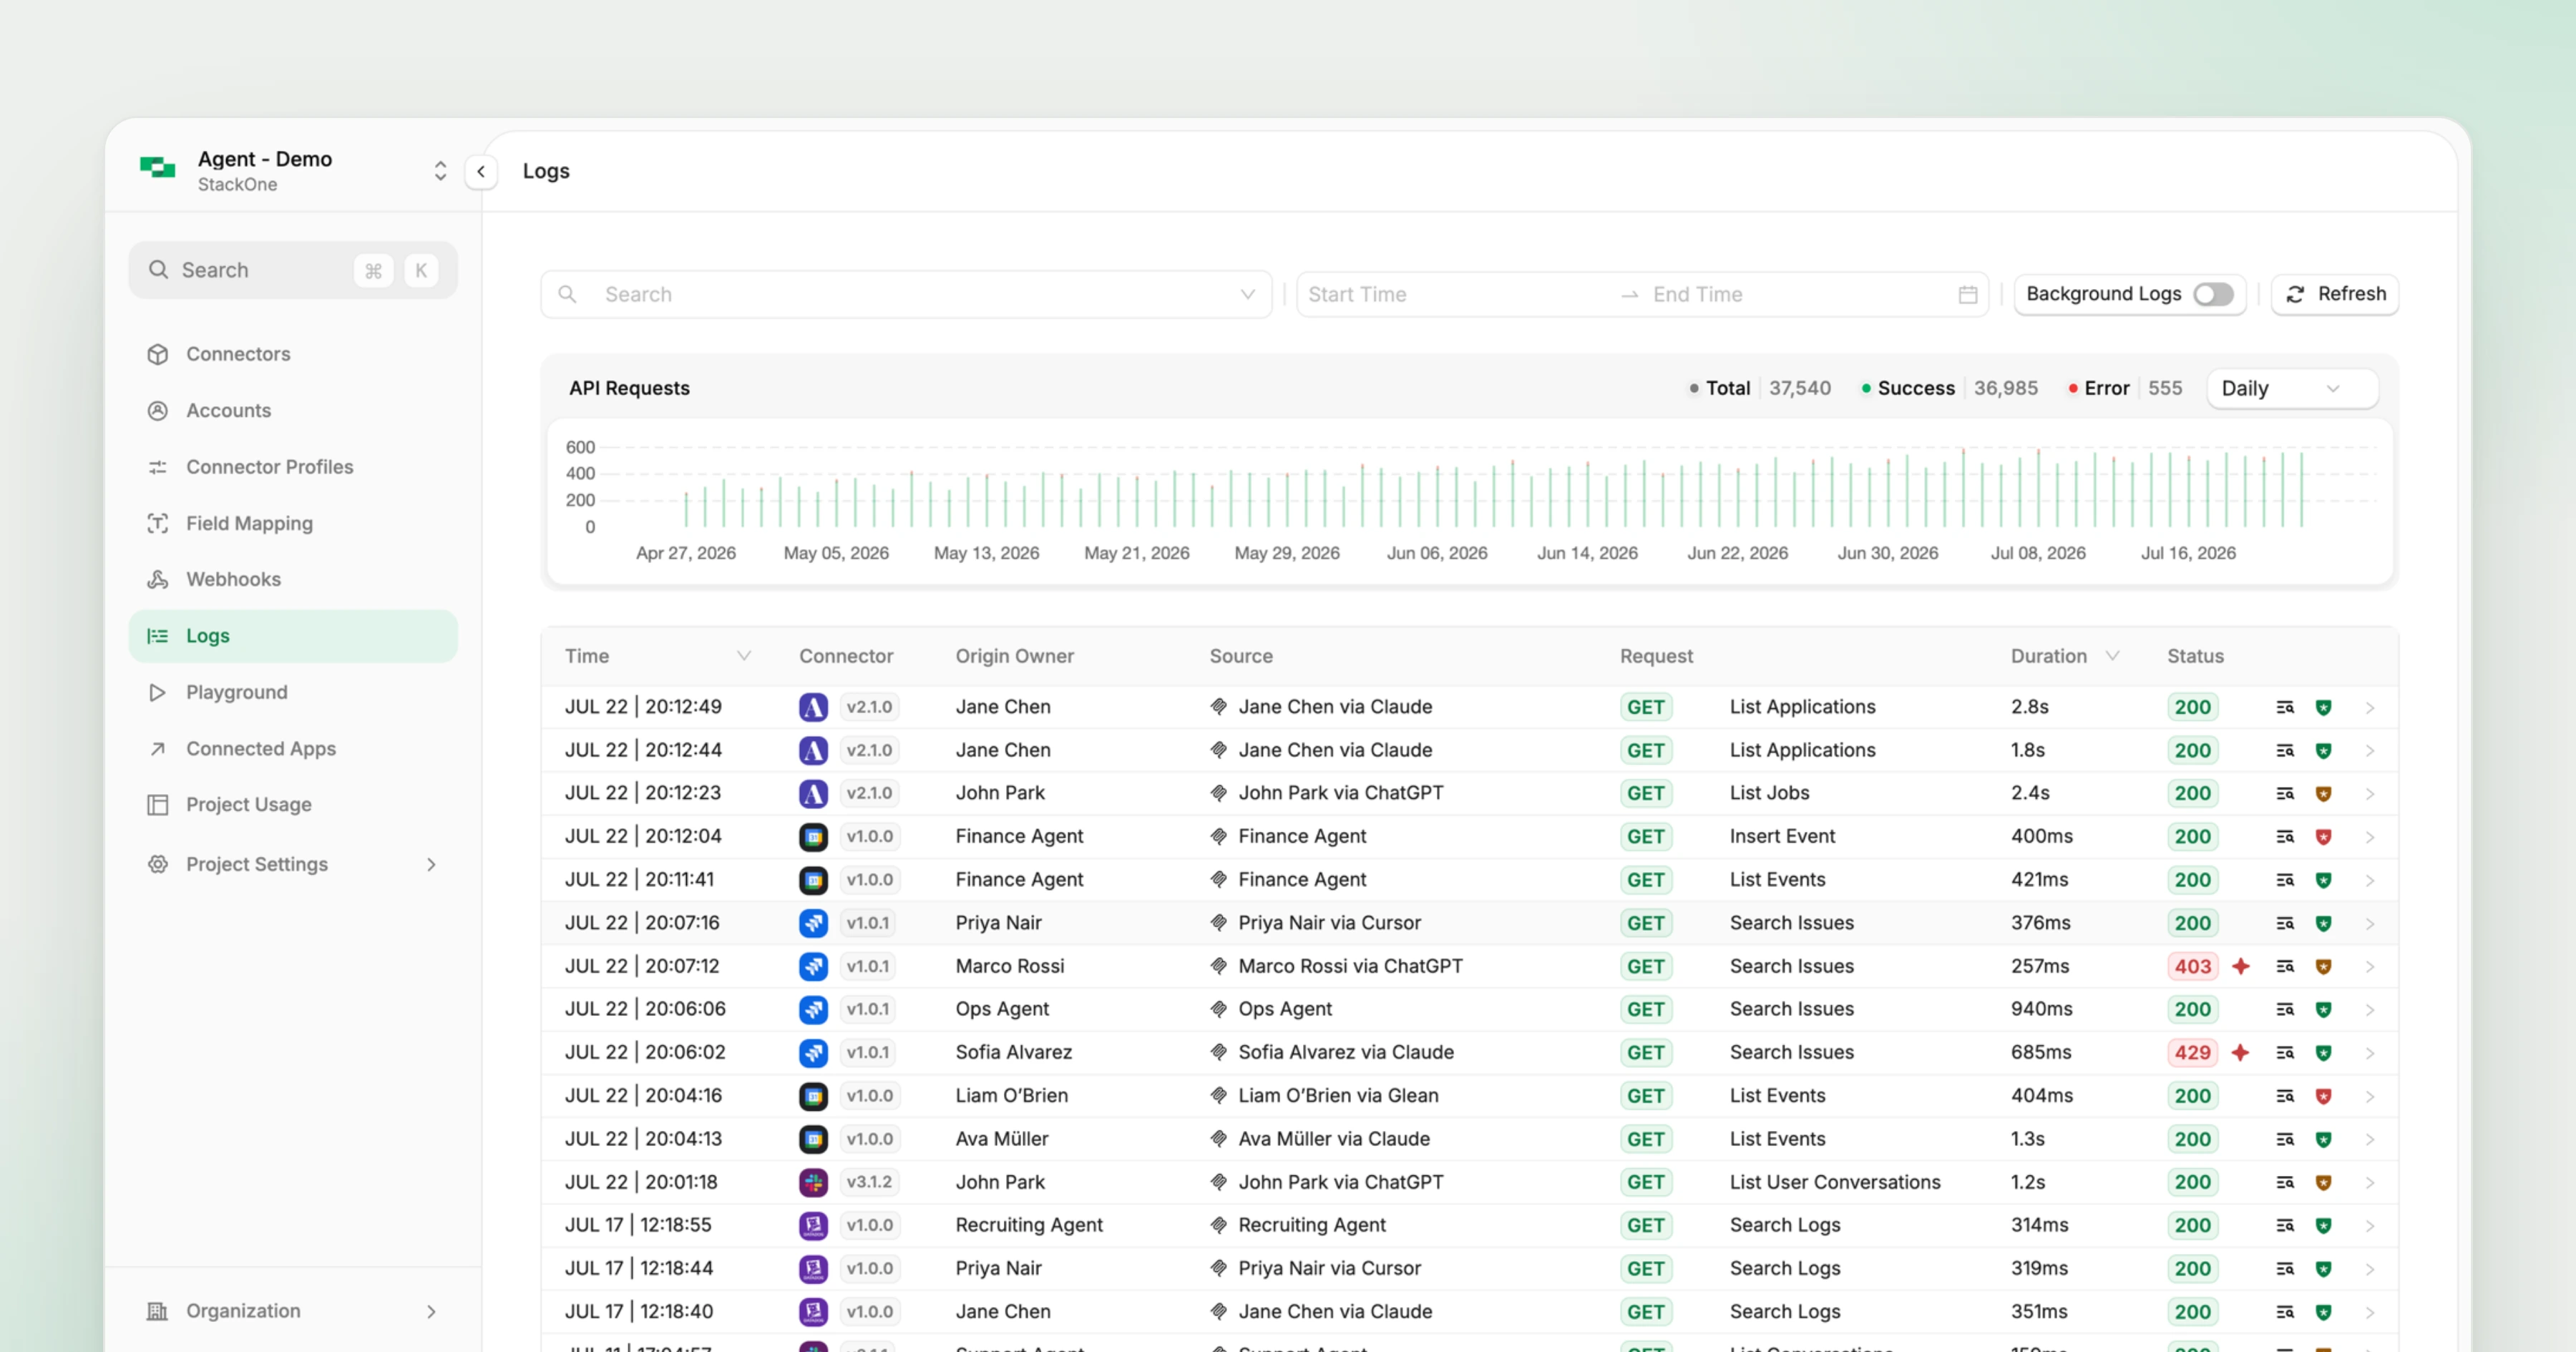
When you run agents in production, you need to answer “what just happened, and why?” without leaving your stack. The Logs page is fully rebuilt, and everything it surfaces is now available two ways: in the dashboard, and through a public Logs API.
It’s a single timeline of API calls, Falcon action runs, webhooks, and OAuth refreshes, each row annotated with connector version, latency, status, and a Defender risk verdict where scanned. Click any row for the full request and response.
What’s new
- Rebuilt Logs page - one timeline for API calls, Falcon action runs, webhooks, and OAuth refreshes, with request charts on the same page. A Background Logs toggle collapses OAuth refreshes and other housekeeping noise.
- Connector version on every row - a chip showing exactly which connector revision served each request, so you can pin a regression to a specific version instead of guessing.
- Defender verdicts inline - scanned rows show their Defender risk verdict where Defender is enabled, with a click-through to the full analysis.
- AI Error Explainer - failed requests surface the AI Error Explainer right in the row, with AI-generated resolution steps so you can debug a 4xx or 5xx without leaving the page.
- Step-by-step traces - when Advanced Logs is enabled, the side panel shows each step a connector took, with the input, output, and transformations for every step.
- Public Logs API - the same request and action logs behind the page are reachable via the Logs API using your existing StackOne API key, so you can pipe them into Datadog, Grafana, or your own data lake.